
This dashboard provides real-time insight into Reverse Osmosis (RO) system performance through a high-level system summary with color-coded indicators that highlight conditions requiring attention.
Dashboard Overview
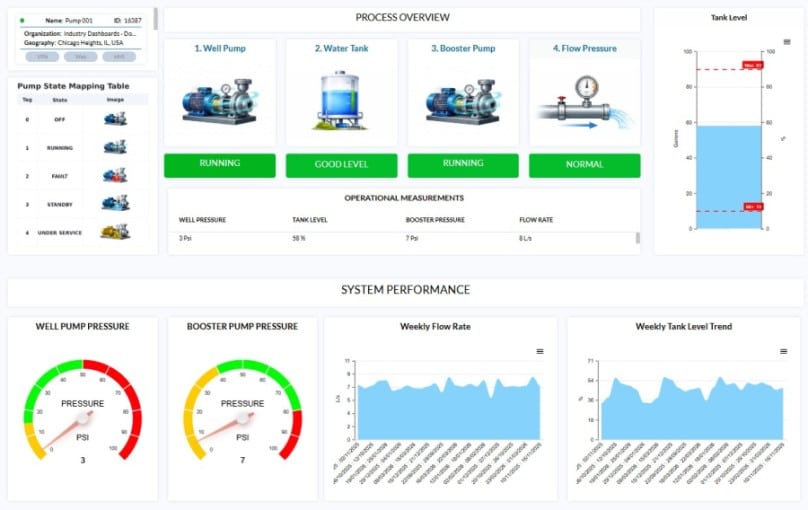
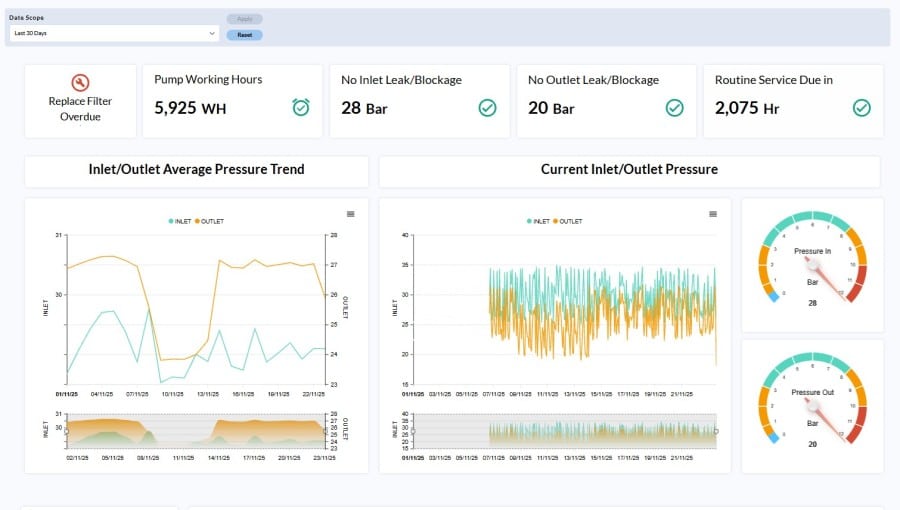
The dashboard provides a structured view of RO system performance, starting with a high-level system summary that uses color indicators to identify abnormal conditions. This overview enables operators to quickly determine whether the system is operating within expected parameters or if issues related to production, water quality, efficiency, energy usage, or maintenance require investigation.
Below the system summary, detailed metrics enable drill-down analysis of permeate production, water quality indicators, recovery efficiency, energy consumption, and membrane conditions. Trend views and historical data help identify performance degradation, abnormal behavior, or changes associated with feed water conditions.
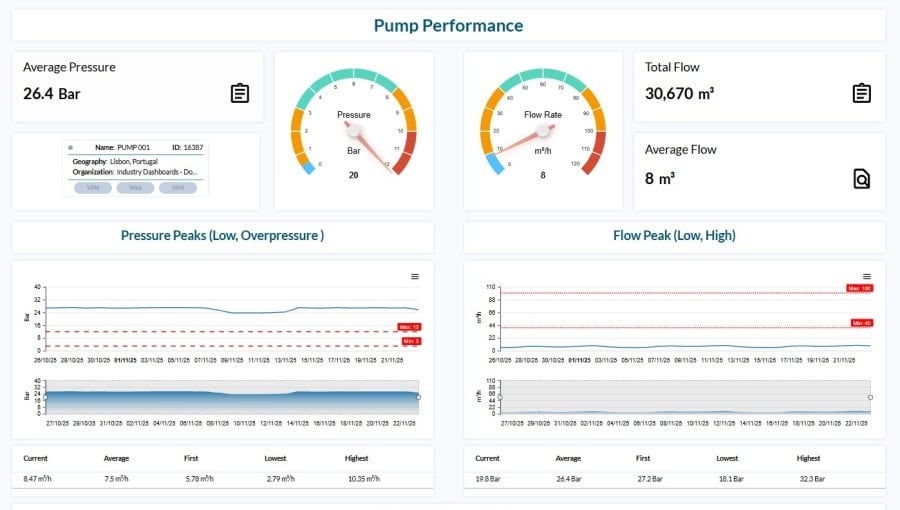
System efficiency metrics indicate how effectively feed water is converted into permeate, with emphasis on recovery rate and overall process optimization. Load and pressure indicators reflect system stress levels, supporting early detection of fouling, scaling, or hydraulic stress within the membranes.
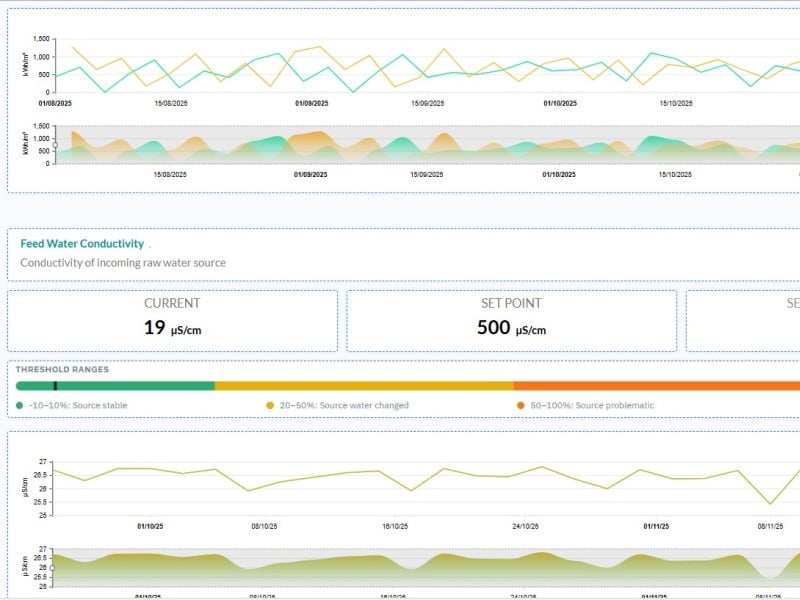
Energy consumption analytics calculate the energy and associated cost required to produce each liter or cubic meter of treated water, supporting operational cost management and sustainability objectives. Cleaning-in-place (CIP) logic evaluates performance degradation trends to recommend optimal cleaning intervals, reducing downtime and preventing membrane damage.
Membrane health indicators track long-term performance trends to estimate remaining membrane life and support proactive replacement planning. Diagnostic comparisons between feed water quality and system behavior help determine whether performance issues originate within the RO system or from external water source conditions.
Together, these insights provide a comprehensive operational view of the RO system, enabling fast troubleshooting, improved efficiency, and reliable long-term operation.
Business Value
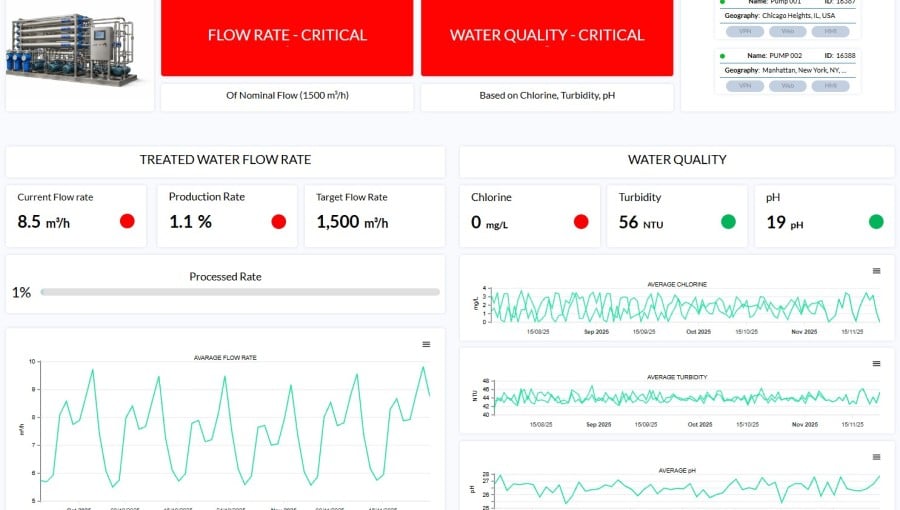
• Ensure water production targets are met through continuous validation of output against operational requirements
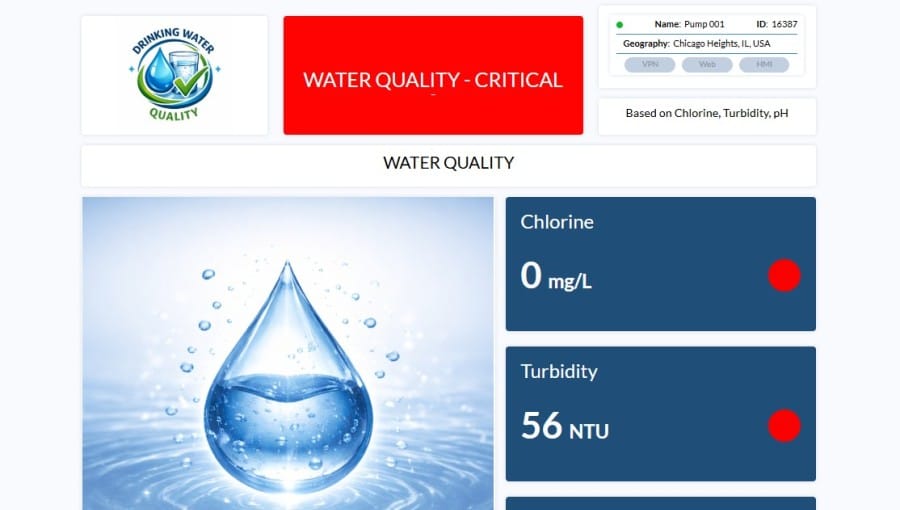
• Maintain water quality compliance by continuously monitoring critical quality indicators
• Improve operational efficiency by reducing energy consumption and minimizing water waste
• Enable predictive maintenance to prevent unplanned downtime and extend membrane life
• Support root-cause analysis by distinguishing internal system issues from feed water-related conditions
• Improve cost control through visibility into energy consumption per cubic meter of treated water
Core Functionalities
• Real-time performance monitoring of permeate flow, water quality, and recovery rate
• Threshold-based status indicators highlighting abnormal flow, conductivity, and pressure conditions
• CIP recommendations based on performance degradation trends
• Membrane health tracking for end-of-life prediction and replacement planning
• Energy consumption metrics expressed as kilowatt-hours per cubic meter
• Root-cause diagnostics comparing feed water quality with system performance
• Efficiency metrics, such as recovery percentage, to reduce water waste
• Integration with live RO system sensors for accurate and actionable insights