Provide a complete real-time view of a Paper Cushioning Machine’s performance as part of a PPU (Pay Per Use) business model by tracking paper usage, box output, cycle time per meter, and production rate. The dashboard helps operators understand how efficiently raw material is converted into packaged boxes.
Dashboard Overview
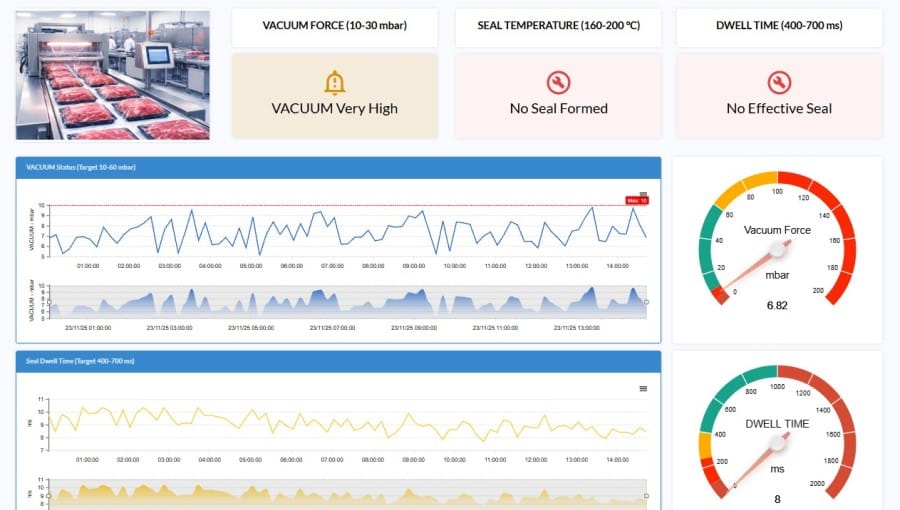
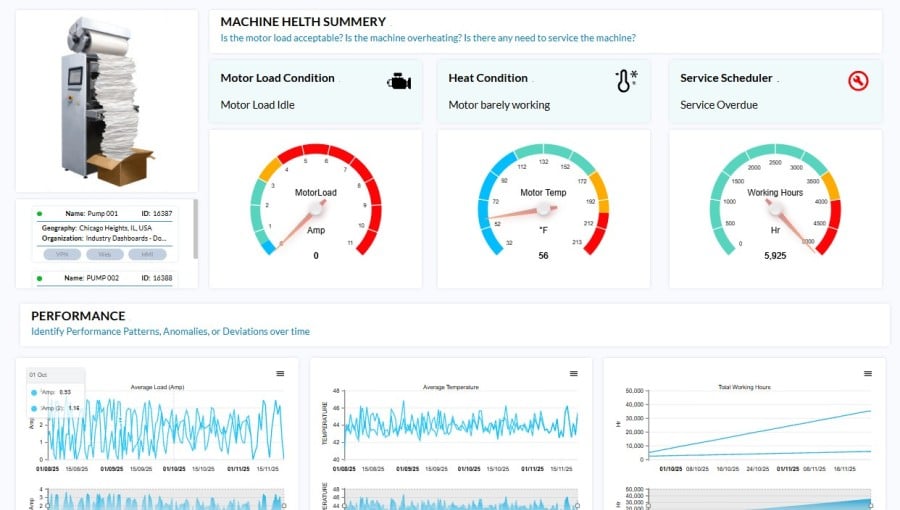
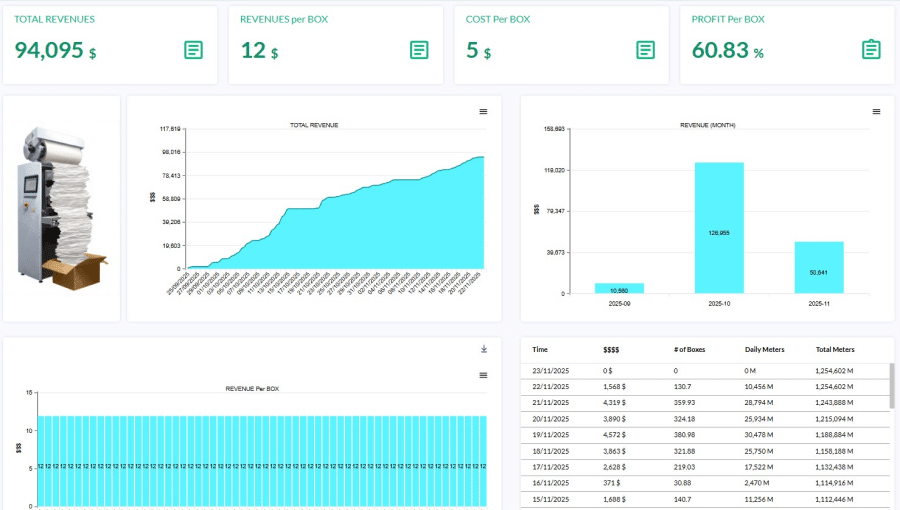
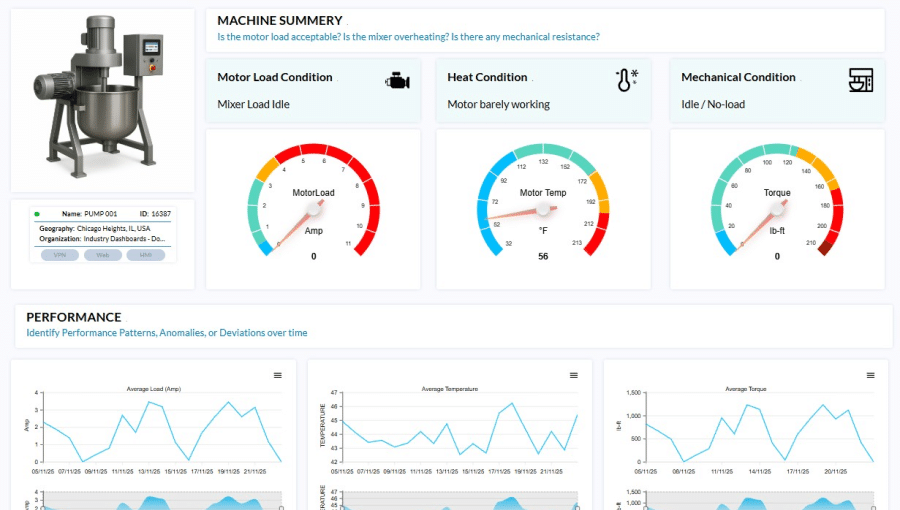
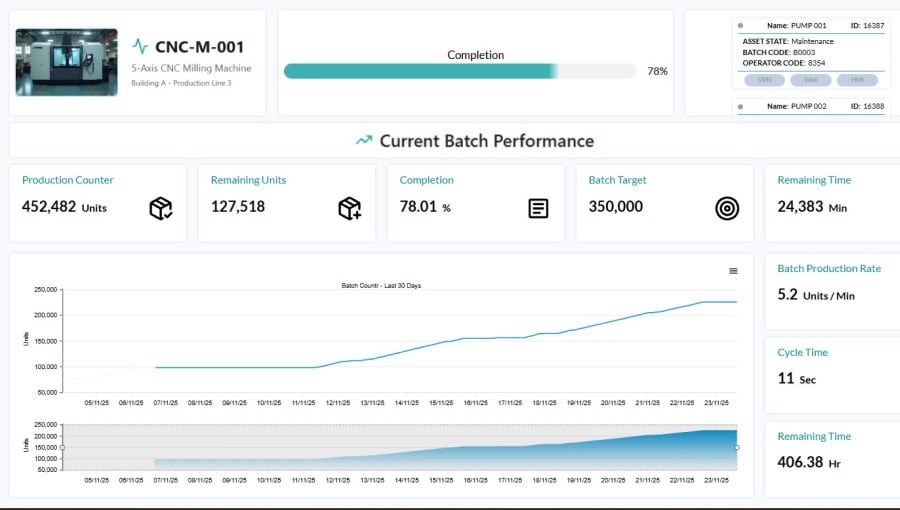
The PPU Performance Dashboard presents a clear summary of key production indicators, including total paper used, total boxes produced, average cycle time for one meter of material, and the current boxes-per-minute rate. These indicators allow operators to quickly assess whether the line is running at the expected speed and material conversion efficiency.
A daily accumulated meters chart shows total paper consumed over time, helping to visualize growth patterns, high-consumption periods, and days with irregular behavior. The cycle time trend chart highlights fluctuations in the time required to process one meter of material, assisting in the detection of inefficiencies, mechanical issues, or slowdowns in production.
The lower section includes a detailed table of daily boxes, daily meters, and total accumulated meters, giving operators a precise day-by-day performance data. The daily paper usage chart visually compares material consumption across days, helping identify usage peaks, low consumption periods, and opportunities to optimize production planning.
Together, these insights provide a clear understanding of material usage efficiency, cycle time stability, and actual production output, enabling better decision-making and improved machine productivity.
Key Benefits
• Assess real-time paper usage and box output to evaluate production performance.
• Monitor cycle time per meter to detect slowdowns or mechanical deviations.
• Identify daily material-consumption trends to improve planning and cost efficiency.
• Analyze production-rate stability and optimize throughput.
• Support predictive and corrective actions with detailed historical data.
Core Functionalities
• Paper Usage Tracking: Monitor accumulated and daily paper consumption.
• Box Production Monitoring: Track total and daily box output with real-time updates.
• Cycle Time Analysis: Evaluate processing time per meter to identify performance irregularities.
• Production Rate Calculation: Display boxes-per-minute for performance validation.
• Daily Consumption History: Provide detailed records of daily meters and daily box counts.
• Trend Visualization: Present consumption and cycle-time trends using intuitive charts.