Create my first dashboard
Follow the steps below:
· Sign-up new Organization
· Login to UniCloud
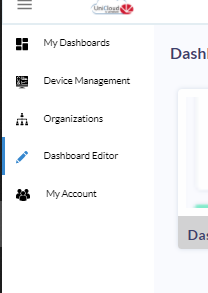
· Go to Dashboard Editor
Build your first Dashboard
1. Create new dashboard
a. Set Dashboard name to: Main Pumping Dashboard
b. Change the date range to last year
c. Press Create
2. Drag and drop the Map widget
a. Wizard step 1 - Asset type – Select Pump
b. Press next button three times and Finish button to get out of the wizard
c. Position the map at the top left of the dashboard Canvas
3. Drag and drop the Table widget
a. Wizard step 1
i. Asset type – Select Pump
ii. Asset Properties select:
1. Asset ID
2. Asset Name
3. Status
4. Data Time Stamp
iii. Press next button
b. Wizard step 2
i. Select last value and Press next
c. Wizard step 3
i. Drag and drop the 4 Asset properties tags selected in step 1 to the Data and Metrics area
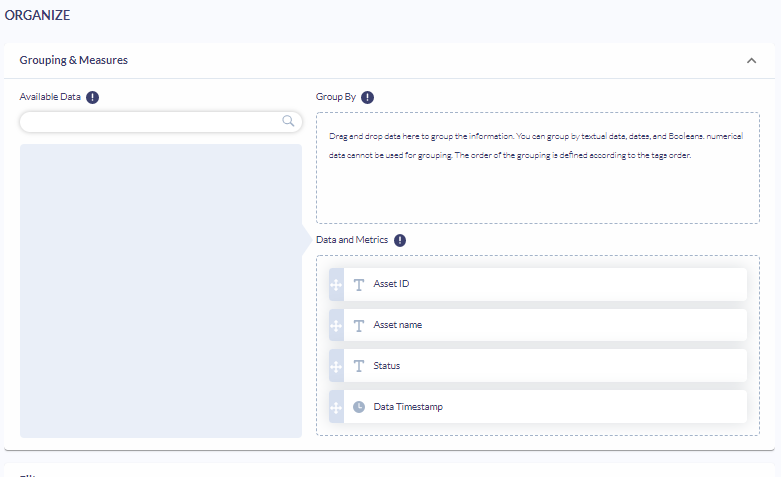
ii. Press next button
d. Wizard step 4
i. Widget Name – update to: Pumping Systems
ii. Rename the Columns header as shown below
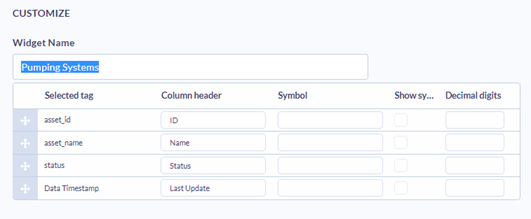
iii. Press next button
e. Wizard step 5 – press finish button
4. Drag and drop the Value Widget
a. Wizard step 1
i. Asset type – Select Pump
ii. Asset Properties select:
1. Asset ID
iii. Press next button
b. Wizard step 2
i. Select Aggregate data and Press next
c. Wizard step 3
i. Drag and drop the Asset ID tag to the data and metrics area
ii. Press next button
d. Wizard step 4
i. Widget Name – Number of Systems
ii. Press next button
e. Wizard step 5 – press finish button
5. Drag and drop the Columns Widget
a. Wizard step 1
i. Asset type – Select Pump
ii. Asset Properties select:
1. Data Time Stamp
iii. Tag Data select:
1. Power Consumption
iv. Press next button
b. Wizard step 2
i. Select Aggregate data and Press next
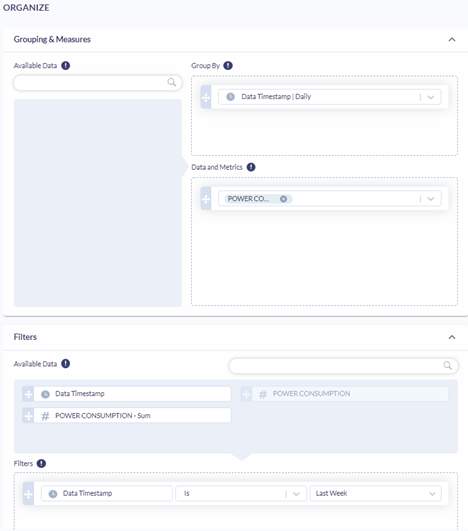
c. Wizard step 3
i. Drag and drop the Data Timestamp tag to the Group by area
ii. Drag and drop the Power Consumption tag to the data and metrics area and select Sum – to show the accumulated power consumption
iii. Open the filters collapsible section
1. Drag and drop the Data Timestamp tag to the filters area and select is and last week as shown below:
d. Wizard step 4
i. Widget Name – Last week Power Consumption
ii. Set Columns width in % to 50
iii. Press next button
a. Wizard step 5 – press finish button
6. Arrange your widget to look like in the image below
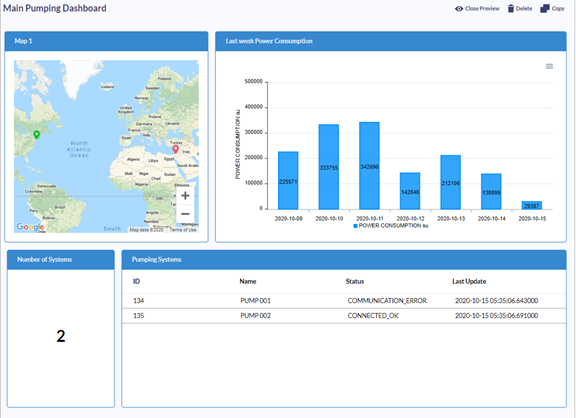
7. Publish the dashboard
Pump Details Dashboard
1. Create new dashboard
a. Set Dashboard name to: Pump Details
b. Press Create
2. Drag and drop the Value Widget
a. Wizard step 1
i. Asset type – Select Pump
ii. Asset Properties select:
1. Asset Name
iii. Press next button
b. Wizard step 2
i. Select Last Value and Press next
c. Wizard step 3
i. Drag and drop the Asset Name tag to the data and metrics area
ii. Press next button
d. Wizard step 4
i. Widget Name – System
ii. Press next button
e. Wizard step 5 – press finish button
3. Drag and drop the Value Widget
a. Wizard step 1
i. Asset type – Select Pump
ii. Asset Properties select:
1. Status
iii. Press next button
b. Wizard step 2
i. Select Last Value and Press next
c. Wizard step 3
i. Drag and drop the Status tag to the data and metrics area
ii. Press next button
d. Wizard step 4
i. Widget Name – System
ii. Press next button
e. Wizard step 5 – press finish button
4. Drag and drop the Map widget
a. Wizard step 1 - Asset type – Select Pump
b. Press next button three times and Finish button to get out of the wizard
c. Position the map at the top left of the dashboard Canvas
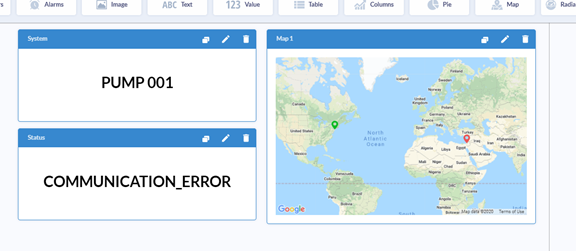
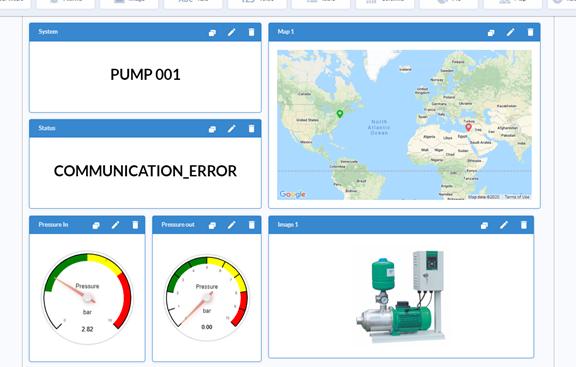
5. Arrange your dashboard to look like in the image below
6. Drag and drop the Radial Gauge Widget
a. Wizard step 1
i. Asset type – Select Pump
ii. Tag Data select:
1. Pressure In
iii. Press next button
b. Wizard step 2
i. Select Last Value and Press next
c. Wizard step 3
i. Drag and drop the Pressure In tag to the data and metrics area
ii. Press next button
d. Wizard step 4
i. Widget Name – Pressure In
ii. Data title: Pressure
iii. Value decimal digits: 2
iv. Data unite: Bar
v. Data tick:
Major:
1. Start: 0
2. End: 10
3. Interval: 1
Zone 1:
4. Start value: 2
5. End Value: 5
6. Interval: 1
Zone 2:
7. Start value: 2
8. End Value: 5
9. Interval: 1
Zone 3:
10. Start value: 2
11. End Value: 5
12. Interval: 1
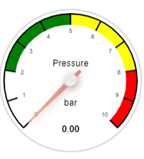
The gauge should look like the image below:
vi. Press next button
e. Wizard step 5 – press finish button
7. Drag and drop the Radial Gauge Widget
a. Wizard step 1
i. Asset type – Select Pump
ii. Tag Data select:
1. Pressure out
iii. Press next button
b. Wizard step 2
i. Select Last Value and Press next
c. Wizard step 3
i. Drag and drop the Pressure out tag to the data and metrics area
ii. Press next button
d. Wizard step 4
i. Widget Name – Pressure out
ii. Data title: Pressure
iii. Value decimal digits: 2
iv. Data unite: Bar
v. Data tick:
Major:
1. Start: 0
2. End: 10
3. Interval: 1
Zone 1:
4. Start value: 2
5. End Value: 5
6. Interval: 1
Zone 2:
7. Start value: 5
8. End Value: 8
9. Interval: 1
Zone 3:
10. Start value: 8
11. End Value: 10
12. Interval: 1
vi. Press next button
e. Wizard step 5 – press finish button
8. Drag and drop the Image Widget
a. Edit widget - Wizard step 1
i. Press browse to select the image
ii. Press next button
b. Wizard step 2 – press finish button
c. Reposition the image
9. Arrange your dashboard to look like in the image below
10. Drag and drop the Table widget
a. Wizard step 1
i. Asset type – Select Pump
ii. Tag Data select:
1. Temperature
2. Speed
iii. Tag Data select All the tags
iv. Press next button
b. Wizard step 2
i. Select Raw data and Press next
c. Wizard step 3
i. Drag and drop the Temperature and Speed tags to the data and metrics area
ii. Press next button
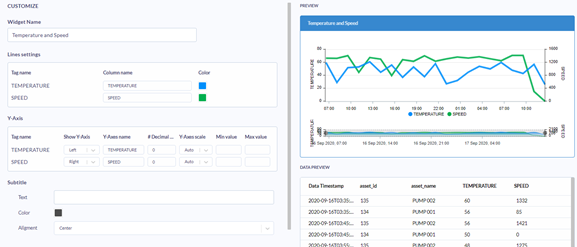
d. Wizard step 4
i. Widget Name – update to: Temperature and Speed
ii. Y-Axis
1. Set Speed to:
a. Show Y-Axis to Right
The setting should look like the image below
i. Press next button
e. Wizard step 5 – press finish button
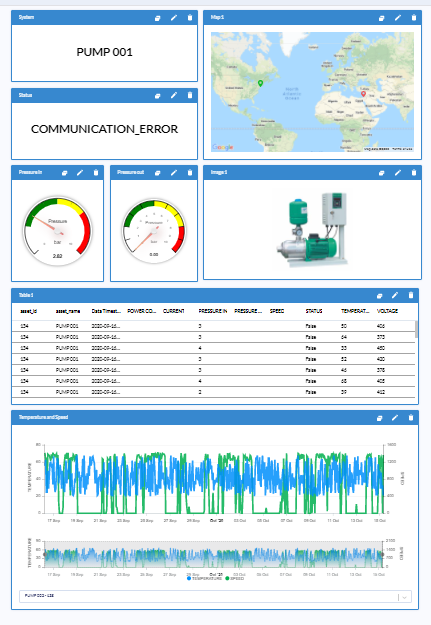
11. Position the widgets to look like the image below
12. Publish the dashboard
Configure navigation between the
dashboards
1. Edit Main Pumping Dashboard
a. Map widget
i. Edit
ii. Go to step 5
iii. Navigate to Dashboard - Select Pump Details
iv. press finish button
b. Table widget
i. Edit
ii. Go to step 5
iii. Navigate to Dashboard - Select Pump Details
iv. Check - filter by Asset ID
v. press finish button
c. Publish the dashboard