Table Widget – Display the Asset’s Raw Data
This topic shows you how to configure a Table widget to display sequential raw data of the selected data tags.
How to Configure it
1. Enter the Dashboard Editor.
2. Drag & drop a Table widget onto the Canvas; the Wizard opens and leads you through the required steps.
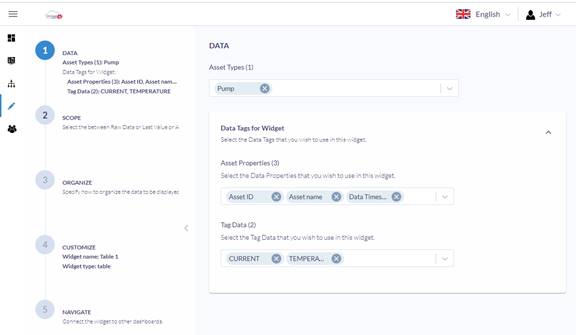
Step 1 – Data
1. Asset Type: click the drop-down arrow, and select the asset with the data you want to display
2. Click Data Tags for Widget;
select the Asset Properties, and, under Tag Data, the tags
you want to present in the Table.
After making your selection, the screen may resemble the image below.
3. Click Next to continue.
Step 2 – Scope
1. Select Raw Data.
2. Click Next to continue.
Step 3 – Organize
Here you can filter and sort your data.
Click Filters to open Available Data and view
the Data Tags and Asset properties selected in Step 1.
1. Drag & drop the tags you want to display in the table to the Filters area.
2. Click Sort, then click the drop-down arrows and make your selections.
Tip | To learn about filtering
and sorting, see the Data filtering and sorting guide. |
3. Click Next to continue.
Step 4 – Customize
Here you customize the look and feel of the widget—names, column sequence,
color, etc.
Customizing is not mandatory and can be left undefined
Tip | To learn how, see the Table customization guide. |
Click Next to continue.
Step 5 – Navigation
Here you configure which dashboard UniCloud will display in response to user clicks. Navigation is not mandatory, and can be left undefined.
Tip | To learn more, see the Dashboard Navigation guide. |
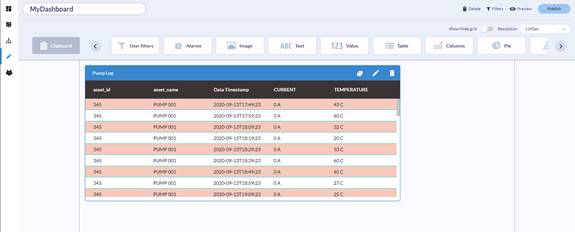
When you are done, click Finish to return to
the Dashboard Canvas.
The widget you have just configured will be displayed at its default size.
Tip | To learn how to work with the Canvas, see the Working with Dashboard Editor guide. |
Related Topics
· Table widget – display Asset’s last
data
· Table widget – display Asset’s
aggregated data